Sky Map Plotting (cosmoplotian.projections)
This code is taken in large part from the module
ligo.skymap.plot.allsky, by Singer. It has been adapted for
plotting of Galactic frame HEALPix maps, and for plotting
rectangular selections in different frames.
Axes subclasses for astronomical mapmaking.
This module adds several astropy.visualization.wcsaxes.WCSAxes
subclasses to the Matplotlib projection registry. The projections have names of
the form astro_or_cosmo [lon_units] projection.
astro_or_cosmo may be astro or cosmo. It controls the
reference frame, either celestial (ICRS) or Galactic.
lon_units may be hours or degrees. It controls the units of
the longitude axis. If omitted, astro implies hours and cosmo
implies degrees.
projection may be any of the following:
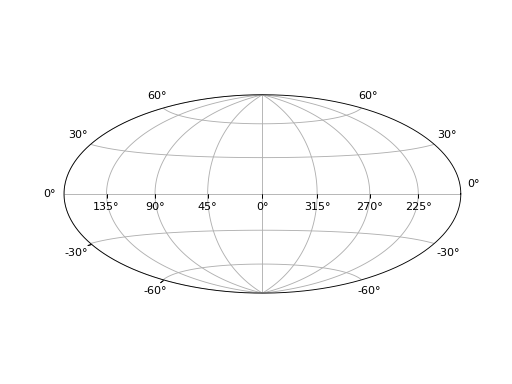
aitofffor the Aitoff all-sky projectionmollweidefor the Mollweide all-sky projectionglobefor an orthographic projection, like the three-dimensional view of the Earth from a distant satellitezoomfor a gnomonic projection suitable for visualizing small zoomed-in patches
Some of the projections support additional optional arguments. The globe
projections support the options center and rotate. The zoom
projections support the options center, radius, and rotate.
Examples
import cosmoplotian
from matplotlib import pyplot as plt
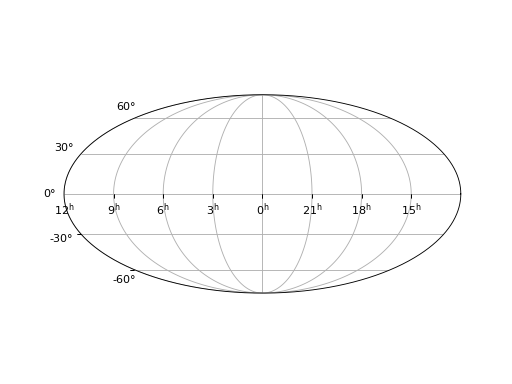
ax = plt.axes(projection='astro hours mollweide')
ax.grid()
(Source code, png, hires.png, pdf)

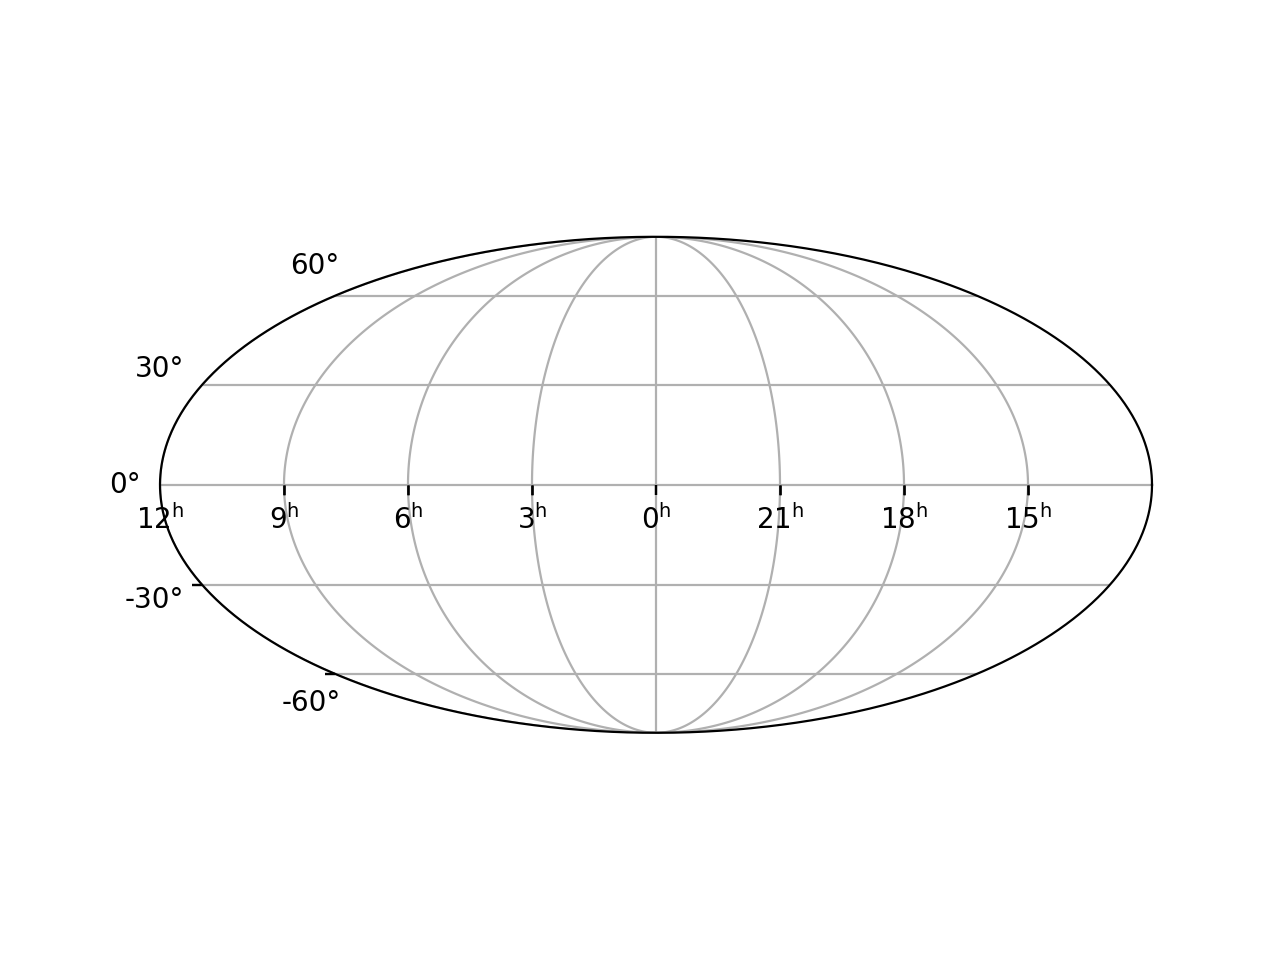
import cosmoplotian
from matplotlib import pyplot as plt
ax = plt.axes(projection='cosmo aitoff')
ax.grid()
(Source code, png, hires.png, pdf)
import cosmoplotian
from matplotlib import pyplot as plt
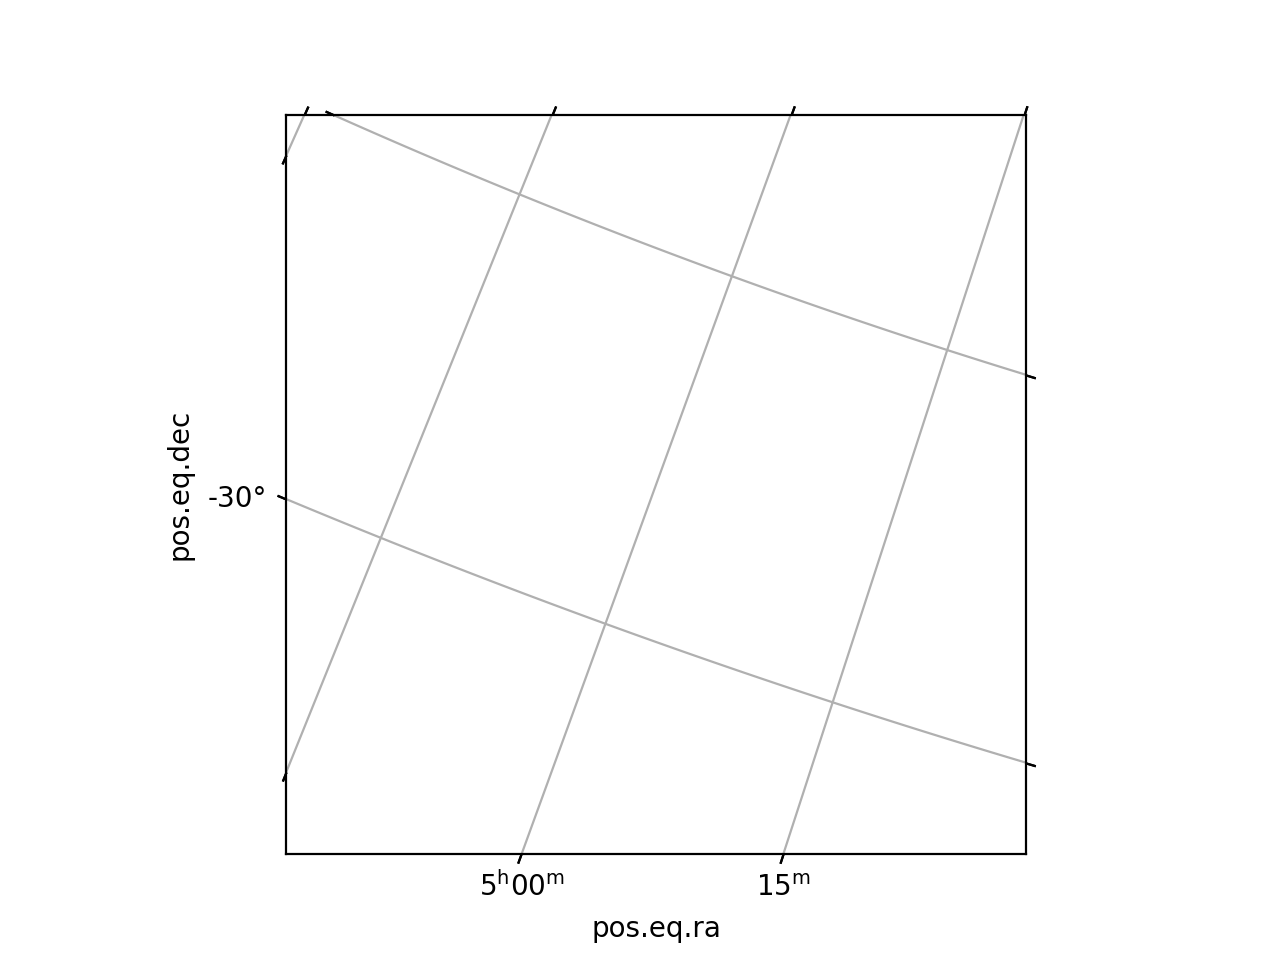
ax = plt.axes(projection='astro zoom',
center='5h -32d', radius='5 deg', rotate='20 deg')
ax.grid()
(Source code, png, hires.png, pdf)
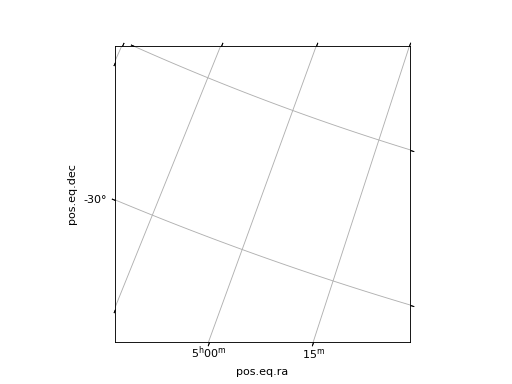
import cosmoplotian
from matplotlib import pyplot as plt
ax = plt.axes(projection='cosmo degrees zoom',
              center='10h -32d', radius='5 deg', rotate='20 deg')
ax.grid()
(Source code, png, hires.png, pdf)
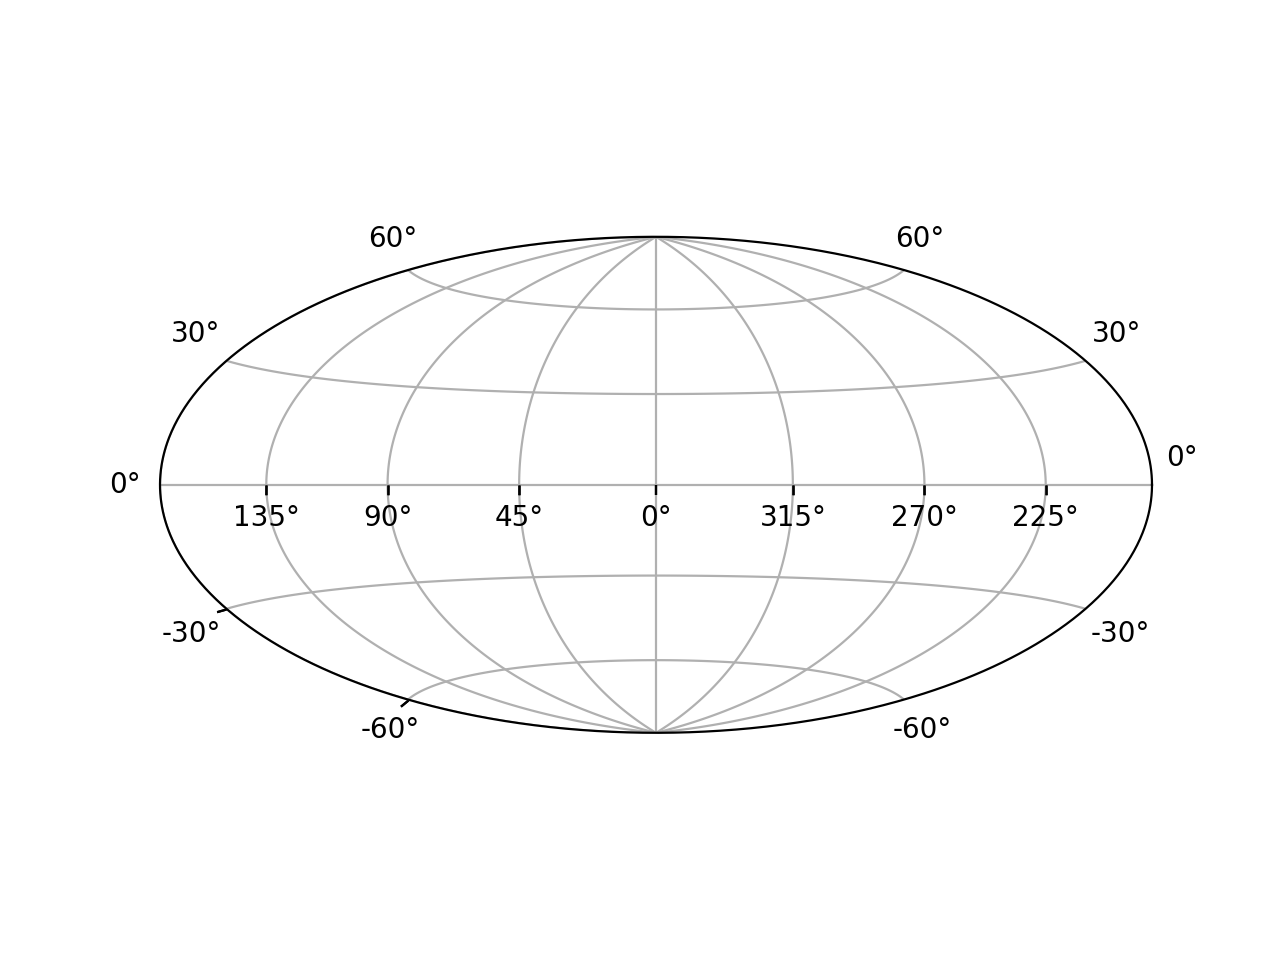
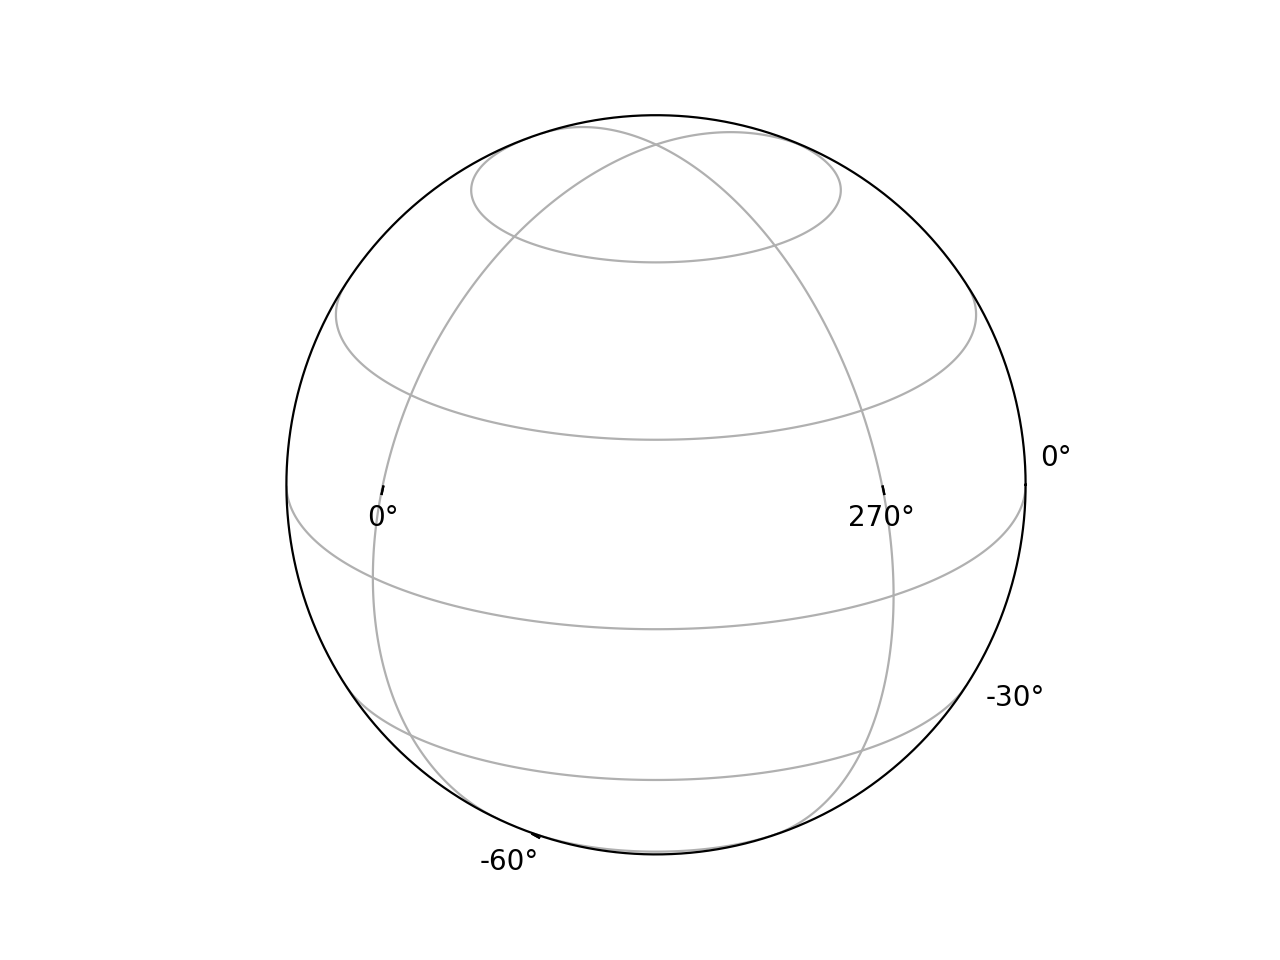
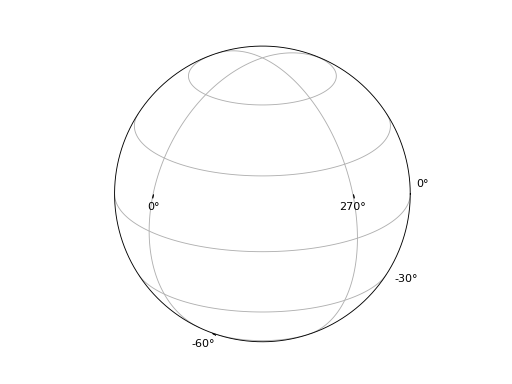
import cosmoplotian
from matplotlib import pyplot as plt
ax = plt.axes(projection='cosmo globe', center='-50d +23d')
ax.grid()
(Source code, png, hires.png, pdf)
-
class
cosmoplotian.projections.AutoScaledWCSAxes(*args, header, obstime=None, **kwargs)[source] [edit on github]¶ Bases:
astropy.visualization.wcsaxes.WCSAxesAxes base class. The pixel scale is adjusted to the DPI of the image, and there are a variety of convenience methods.
-
compass(x, y, size)[source] [edit on github]¶ Add a compass to indicate the north and east directions.
- Parameters
- x, yfloat
Position of compass vertex in axes coordinates.
- sizefloat
Size of compass in axes coordinates.
-
connect_inset_axes(ax, loc, *args, **kwargs)[source] [edit on github]¶ Connect a corner of another WCSAxes to the matching point inside this one.
- Parameters
- ax
astropy.visualization.wcsaxes.WCSAxes The other axes.
- locint, str
Which corner to connect. For valid values, see
matplotlib.offsetbox.AnchoredOffsetbox.
- ax
- Other Parameters
- args :
Extra arguments for
matplotlib.patches.ConnectionPatch- kwargs :
Extra keyword arguments for
matplotlib.patches.ConnectionPatch- Returns
- ——-
- patch
matplotlib.patches.ConnectionPatch
-
contour_hpx(data, hdu_in=None, order='bilinear', nested=False, field=0, smooth=None, **kwargs)[source] [edit on github]¶ Add contour levels for a HEALPix data set.
- Parameters
- data
numpy.ndarrayor str orTableHDUorBinTableHDUor tuple The HEALPix data set. If this is a
numpy.ndarray, then it is interpreted as the HEALPix array in the same coordinate system as the axes. Otherwise, the input data can be any type that is understood byreproject.reproject_from_healpix.- smooth
astropy.units.Quantity, optional An optional smoothing length in angle-compatible units.
- data
- Returns
- countours
matplotlib.contour.QuadContourSet
- countours
- Other Parameters
- hdu_in, order, nested, field, smooth :
Extra arguments for
reproject.reproject_from_healpix- kwargs :
Extra keyword arguments for
matplotlib.axes.Axes.contour
-
contourf_hpx(data, hdu_in=None, order='bilinear', nested=False, field=0, smooth=None, **kwargs)[source] [edit on github]¶ Add filled contour levels for a HEALPix data set.
- Parameters
- data
numpy.ndarrayor str orTableHDUorBinTableHDUor tuple The HEALPix data set. If this is a
numpy.ndarray, then it is interpreted as the HEALPix array in the same coordinate system as the axes. Otherwise, the input data can be any type that is understood byreproject.reproject_from_healpix.- smooth
astropy.units.Quantity, optional An optional smoothing length in angle-compatible units.
- data
- Returns
- Other Parameters
- hdu_in, order, nested, field, smooth :
Extra arguments for
reproject.reproject_from_healpix- kwargs :
Extra keyword arguments for
matplotlib.axes.Axes.contour
-
imshow_hpx(data, hdu_in=None, order='bilinear', nested=False, field=0, smooth=None, **kwargs)[source] [edit on github]¶ Add an image for a HEALPix data set.
- Parameters
- data
numpy.ndarrayor str orTableHDUorBinTableHDUor tuple The HEALPix data set. If this is a
numpy.ndarray, then it is interpreted as the HEALPix array in the same coordinate system as the axes. Otherwise, the input data can be any type that is understood byreproject.reproject_from_healpix.- smooth
astropy.units.Quantity, optional An optional smoothing length in angle-compatible units.
- data
- Returns
- Other Parameters
- hdu_in, order, nested, field, smooth :
Extra arguments for
reproject.reproject_from_healpix- kwargs :
Extra keyword arguments for
matplotlib.axes.Axes.contour
-
mark_inset_axes(ax, *args, **kwargs)[source] [edit on github]¶ Outline the footprint of another WCSAxes inside this one.
- Parameters
- ax
astropy.visualization.wcsaxes.WCSAxes The other axes.
- ax
- Returns
- Other Parameters
- args :
Extra arguments for
matplotlib.patches.PathPatch- kwargs :
Extra keyword arguments for
matplotlib.patches.PathPatch
-
scalebar(*args, **kwargs)[source] [edit on github]¶ Add scale bar.
- Parameters
- xytuple
The axes coordinates of the scale bar.
- length
astropy.units.Quantity The length of the scale bar in angle-compatible units.
- Returns
- Other Parameters
- args :
Extra arguments for
matplotlib.patches.FancyArrowPatch- kwargs :
Extra keyword arguments for
matplotlib.patches.FancyArrowPatch
-